Machine Learning: Clustering Text documents

What is Clustering?
- It’s an unsupervised learning algorithm which groups the given data, such that data points with similar behaviour are merged into one group called clusters.
- Cluster is the collection of data objects which are similar to one another within the same group (class or category) and are different from the objects in the other clusters.
Clustering algorithm does not predict an outcome or target variable but can be used to improve predictive model. Predictive models can be built for clusters to improve the accuracy of our prediction.
- In our daily life, we group different activities according to their utility. This grouping is what you need to learn.
Why Clustering?
- Detecting distinct kinds of pattern in image data (Image processing). It’s effective in biology research for identifying the underlying patterns.
- Given a collection of text, we need to organize them, according to the content similarities to create a topic hierarchy.
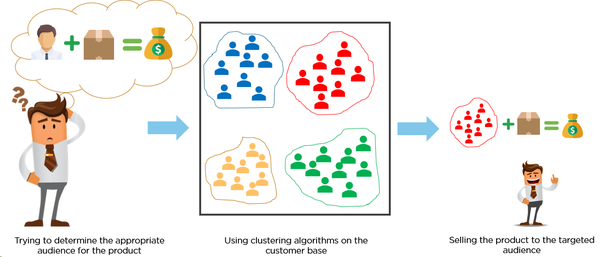
- In marketing, customers are segmented according to similarities to carry out targeted marketing.
Four of the most used clustering algorithms:
- K-means
- Fuzzy K-means
- Hierarchical clustering
- Mixture of Gaussians
While, K-means is an exclusive clustering algorithm, Fuzzy K-means is an overlapping clustering algorithm, Hierarchical clustering is obvious and lastly Mixture of Gaussians is a probabilistic clustering algorithm.
K-Means Clustering
K-means tries to partition x data points into the set of k clusters where each data point is assigned to its closest cluster. This method is defined by the objective function which tries to minimize the sum of all squared distances within a cluster, for all clusters.
The algorithm is composed of the following steps:
- Let X = {x1,x2,x3,……..,xn} be the set of data points and V = {v1,v2,…….,vc} be the set of centers.
- Randomly select ‘k’ cluster centers.
- Calculate the distance between each data point and cluster centers.
- Assign the data point to the cluster center whose distance from the cluster center is minimum of all the cluster centers.
- Recalculate the new cluster center using:
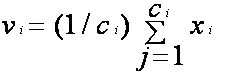
where, ‘ci’ represents the number of data points in ith cluster.
- Recalculate the distance between each data point and new obtained cluster centers.
- If no data point was reassigned then stop,otherwise again Calculate the distance between each data point and cluster centers and so on.
How to select the best K…
-
The algorithm clusters the data into k clusters, even if k is not the right number of clusters to use. Therefore, when using k-means clustering, users need some way to determine whether they are using the right number of clusters.
-
One method to validate the number of clusters is the elbow method. The idea of the elbow method is to run k-means clustering on the dataset for a range of values of k (say, k from 1 to 10 in the examples above), and for each value of k calculate the sum of squared errors (SSE).
-
Silhouette Score: Used to study the separation distance between the resulting clusters. The silhouette plot displays a measure of how close each point in one cluster is to points in the neighbouring clusters.
Using Scikit-learn library
- class sklearn.cluster.KMeans(n_clusters=8, init=’k-means++’, n_init=10, max_iter=300, tol=0.0001, precompute_distances=’auto’, verbose=0, random_state=None, copy_x=True, n_jobs=None, algorithm=’auto’)
- n_clusters : int, optional, default: 8 The number of clusters to form as well as the number of centroids to generate.
- init : {‘k-means++’, ‘random’ or an ndarray} Method for initialization, defaults to ‘k-means++’: ‘k-means++’ : selects initial cluster centers for k-mean clustering in a smart way to speed up convergence. See section Notes in k_init for more details. ‘random’: choose k observations (rows) at random from data for the initial centroids. If an ndarray is passed, it should be of shape (n_clusters, n_features) and gives the initial centers.
- max_iter : int, default: 300 Maximum number of iterations of the k-means algorithm for a single run.
- algorithm : “auto”, “full” or “elkan”, default=”auto”
K-means algorithm to use.
Clustering the 20NewsGroup dataset
- The 20 newsgroups dataset comprises around 18000 newsgroups posts on 20 topics
Libraries Required
- from sklearn.datasets import fetch_20newsgroups
- from sklearn.feature_extraction.text import TfidfVectorizer
- import numpy as np
- from sklearn.cluster import KMeans
- from sklearn import metrics
Steps
- Load data (from the scikit-learn package)
- Select subset of data
dataset = fetch_20newsgroups(subset='all', categories=categories, shuffle=True, random_state=42) - Preprocess data
- Apply tfidf to vectorize the data
vectorizer = TfidfVectorizer(max_df=0.5,
                           min_df=2,
                           stop_words='english')
X = vectorizer.fit_transform(dataset.data)
TfidfVectorizer uses a in-memory vocabulary (a python dict) to map the most frequent words to features indices and hence compute a word occurrence frequency (sparse) matrix. The word frequencies are then reweighted using the Inverse Document Frequency (IDF) vector collected feature-wise over the corpus.
- Run K-Means clustering
km = KMeans(n_clusters=20, init='k-means++', max_iter=100, n_init=1) km.fit(X) - Locate centroids and print the respective features
order_centroids = km.cluster_centers_.argsort()[:, ::-1] terms = vectorizer.get_feature_names() for i in range(true_k): print("cluster %d:" % i) for ind in order_centroids[i,:20]: print('%s' % terms[ind]) print() - Measure effectiveness
print("Homogeneity: %0.3f" % metrics.homogeneity_score(labels, km.labels_))
print("Completeness: %0.3f" % metrics.completeness_score(labels, km.labels_))
print("V-measure: %0.3f" % metrics.v_measure_score(labels, km.labels_))
print("Silhouette Coefficient: %0.3f"
    % metrics.silhouette_score(X, km.labels_, sample_size=1000))
Homogeniety: degree to which clusters contain element of the same class Completeness : degree to which all elements belonging to certain category are found in a cluster V-measure : mean of homogeniety and completeness Silhouette score : how similar an object is to its own cluster .
- Output results
Homogeneity: 0.486
Completeness: 0.289
V-measure: 0.362
Silhouette Coefficient: 0.016
Some drawbacks of K-Means
-
The result might not be globally optimal: We can’t assure that this algorithm will lead to the best global solution. Selecting different random seeds at the beginning affects the final results.
-
Value of K need to be specified beforehand: We can expect this value only if we have a good idea about our dataset and if we are working with a new dataset then elbow method can be used to determine value of K.
-
Works only for linear boundaries: K-means makes this assumption that the boundaries will be always linear. Hence it fails when it comes to complicated boundaries.
-
Slow for large number of samples: As this algorithm access each point of the dataset, it becomes slow when the sample size grows.
For code, see the GitHub repository here.